

The University of Oxford has released its 2019 “Annual Admissions Statistical Report”, presenting minor improvements in accessibility in all categories and a significant increase in the total number of applications.
The 2018 intake saw an increase in the proportion of students admitted from state schools from 57.2% to 60.5%, as well as a 4.7% increase in the number of BME students admitted. The total number of applications also increased by 1577 from 19,938 in 2017 to 21,515 in 2018, including an 11.2% increase in the number of disabled applicants from 1080 to 1201.
In her introduction to the report, Vice Chancellor Louise Richardson wrote: “It was precisely because of our concern that the pace of change was too slow that this year we are increasing the size of our flagship summer programme UNIQ by 50% to 1375 school pupils.
“We also announced the creation of two new programmes, Opportunity Oxford and Foundation Oxford, which we believe will significantly accelerate the pace of change. When both programmes are up and running in four years’ time we expect that one in four of those admitted to Oxford will be from a deprived background.
“The entire University community, colleges and halls, departments and divisions, have united behind a commitment to effect a sea change in our admissions practices.”
In a statement to the press, the University said: “The new figures, for Oxford’s 2018 intake, show a solid foundation for the two major access initiatives announced by the University last month, which are due to accelerate the pace of change dramatically.
“The report is being published for the second year, as part of the University’s commitment to greater openness about its admissions process.”
The statement also claimed that: “Early figures for 2019 entry show still more progress. Offers to state school pupils are up again, to 64.5%.
“Offers to students from areas of low progression to higher education is up to 13.8%. However, the University is determined to move faster.”
Oxford SU’s VP for Access and Academic Affairs told Cherwell: “It is a major positive step that the University is continuing to release annual admissions data.
“The figures themselves show an incremental improvement – which is welcome, though still not at the pace we would like to see.
“Oxford SU has campaigned hard over the past 18 months to see tangible work be done to improve these figures and the future plans around the two major initiatives will go a long way to bring around a sea change.”

Region
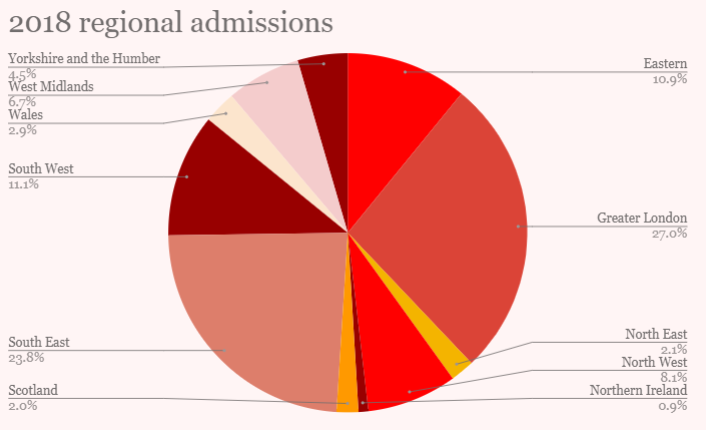
Students from London and the South East made up 47.2% of all applications and accounted for 48.7% of students admitted to Oxford in the academic cycles of 2016-2018. Of the 1577 increase in applications in the last year, 49% was accounted for by increased applications from these regions.
The figure is significantly greater than undergraduates from the North East, who comprised 2.1% of students admitted over the period, with 159 students matriculating from the region, versus 2,005 from the South East.
Scotland, Wales and Northern Ireland together accounted for 6.6% of admissions. The University’s breakdown of application and admission by region pairs together figures from the last two admissions cycles, showing an ongoing gap in numbers of admitted students between regions in the South of the UK and those in the North.
When compared to 2016-2017 statistics, successful admissions by London increased by 4.2%, but this positive growth was not shared by the South East. The region saw another 266 applications when compared to the previous cycle, but still registered -1.2% decline in successful candidates.
Most other regions noted only minor changes in their application and admissions rates. Among these, the South West saw 133 more applications but a drop of 25 in admissions and the West Midlands saw 19 more successful candidates accompanying 96 more applications.
Almost all regions around the UK measured a slight decrease in admissions, averaging -1% across the board, a statistic that comes in light of increased competition for places and a rising acceptance rate for international students.
School type
The number of students applying to Oxford from UK state schools has increased by 5.7% from the previous year, a rise of 442 students, whilst the number applying from independent schools rose by just 0.5%.
The period also saw a small increase of 3.3% in the number of students from UK state schools as a percentage of the total intake. The number of places taken by independent school students also fell from 1029 to 981, marking a decrease of 2.3% as a percentage of all students accepted.
Over 90% of students admitted to study at Mansfield attended UK state schools, compared to just 48.3% at Trinity, the worst-performing college. Over 60% of students were admitted from state schools at 12 of Oxford’s 29 colleges. Only Trinity offered fewer than 50% of its places to state educated students.
Classics continued to offer the fewest places to state school students at just 29.2%, and was the only subject to offer more than 60% of places to independent school students. Maths and Computer Science admitted the highest proportion of state school students at 76.8%, closely followed by Computer Science at 76.3%, Mathematics at 73.3%, and Law at 73.1%.
Between 2016 and 2018, 37% of state applications were to five of the most oversubscribed subjects, including Economics and Management, Medicine, PPE, Law, and Maths. By contrast 20% of independent school applicants were for the five least oversubscribed subjects: Classics, Music, Modern Languages, Chemistry, and English.
Background
The number of students from Acorn 4 and 5 backgrounds (the most disadvantaged in the UK) also increased this year, from 16.2% to 20.25%, an increase of 110. However, the number of students from POLAR 1 and 2 backgrounds decreased from 19.04% to 17.81%.
The POLAR system is a tool which measures how likely young people are to participate in higher education based on where they live. POLAR 1 and 2 are the most disadvantaged backgrounds listed.
At New College, the number of students admitted from Acorn 4 and 5 backgrounds fell by 4.6%, compared to a 3% increase at Mansfield. Only New and Queen’s saw a decrease in the number of students being admitted from disadvantaged backgrounds.

Ethnicity
The University’s report suggested a significant offer gap between UK applicants based on their ethnicities. In 2018, across the University 25.5% of white applicants received an offer, compared to 15% of Asian British applicants and 17.8% of applicants of all BME backgrounds. This offer gap appears to have changed little from 2017, when 17.9% of BME applicants received an offer compared to 25.9% of white applicants.
All colleges have each been found to admit a greater proportion of white applicants than BME applicants. Most notably, at St Hilda’s 43% of white applicants received an offer compared to 11% of black applicants and 25% of BME applicants as a whole. A similar gap was found at St Anne’s, where 40% of white applicants received an offer compared to 12% of black applicants and 19% of BME applicants as a whole. At St Anne’s and Teddy Hall, white applicants were at least twice as likely as BME applicants to receive an offer.
The number of BME students as a proportion of all admitted students has risen since 2014, from 13.6% to 18.3%. However, there is significant variation between colleges. At Magdalen, BME students make up just 10.8% of UK students admitted, compared to 21.8% at LMH.
At every college the offer rate was greater for white students than for Asian students. At Trinity, 28.2% of white applicants received an offer, while 11.1% of Asian applicants did. At St John’s, 17.6% of white applicants received an offer compared to 7.7% of Asian applicants.
There was also a significant gap in the conversion rate between offer-holders and admitted students for BME students compared to white students. At Magdalen, 72% of BME offer-holders were admitted between 2016 and 2018, while 90% of white offer-holders were admitted. However, at Mansfield, the conversion rate was very similar, with 86% of BME offer-holders admitted, compared to 83% of white offer-holders.
Gender
The proportion of UK-domiciled undergraduate students admitted to Oxford who identify as female has risen every year between 2014 and 2018. In 2014, 46.5% of admitted students identified as female, whereas last year the total had risen to 51.2%. For comparison, among Russell Group universities as a whole the most recent statistics in 2016 show that 55.4% of admitted students were female.
The University’s report also contained a breakdown of gender by subject, demonstrating a “wide variety” in male-to-female ratios among Oxford’s 25 main courses. The results covered UK-domiciled students over a three-year period between 2016 and 2018.
Experimental psychology, Biomedical sciences and English recorded the highest proportion of female UK students, with 79.3%, 74.7%, and 72.1% respectively. However, only 9.8% of UK students admitted to study Computer Science identified as female. Maths and Computer Science also saw a low intake of women, at 15.8%, with Physics at 18.3%, Engineering Science at 20.2%, Economics and Management at 27.5% and Maths at 28.5%.
Across the three-year 2016-2018 period, 19,301 UK men applied in total compared to 18,488 UK women. At the majority of colleges, more men applied than women, though this was not true at Lady Margaret Hall, which received 707 applications from women compared to just 486 from men. Similarly, Wadham College had 868 female applicants and only 684 male applicants.
The report also showed that the majority of colleges had a relatively even male-to-female ratio. However, this was not true of Balliol, where only 38.7% of students admitted were female, making it the college with the most unequal gender split of UK students. Female students also made up only 40.7% of total UK admissions for New College and 44.4% at Magdalen.
Lady Margaret Hall and St Hilda’s College had the highest proportion of women, with 57.9% and 57% of the total admissions respectively. Both of these colleges are former women’s colleges, as is St. Anne’s, in which 55.7% of total admissions were given to women. At Hertford, female students made up 55.8% of admissions.
Disability
According to the report, the number of admitted students who declare a disability has increased. In 2014, 6.0% of UK-domiciled students declared a disability, but this has risen to 9.2% of total admissions in 2018. Across the three-year period of 2016-2018, 623 admitted students declared disabilities, amounted to 8.0% of the total UK intake in this period.
This figure for Oxford’s 2018 intake is slightly lower than equivalent figures for other universities. The most recently published statistics in 2016 show that disabled students made up 11.9% of the total intake at all Russell Group universities.
The report also included a study into the categories of disabilities among applicants over the three-year period. Approximately 36% of these students declared themselves as having a learning difficulty, such as dyslexia, dyspraxia, and ADHD. A further 18.9% declared a disability that was categorised as a mental health problem.
The remaining 45.1% declared disabilities including autistic spectrum disorder, blind/ partial sight, deaf/partial hearing, longstanding illness, and wheelchair/mobility issues. Also included were “multiple disabilities” and “other disabilities”. No disability statistics for non-UK admissions were published in the report.
Nationality
In 2016-18 admissions to students from the US were up 23.5% on 2015-17 figures, whilst admissions to students from China were up 19.9%, and admissions to students from France were down 10.9%. Italy and France remain the most difficult places to apply to Oxford from, with an average acceptance rate of 7.1% and 7.6% respectively. The average acceptance rate for UK applicants has fallen 0.8% to 20.5%.
Reporting by Angus Brown, Amelia Horn, Sam Millward, Charlotte Moberly, and Ben van der Merwe.